
Exploring Montreal's Bike Sharing Program: Bixi
Bixi is a non-profit organization tasked with managing the city of Montreal’s public bike system. Created in 2014, BIXI manages 9,500 bikes and over 700 stations. As a part of the public transit solution for the city, it offers bikes to every member of the public on a pay-per-use basis. They also offer seasonal and monthly memberships for dedicated users.
My initial task is to review data from the 2016 and 2017 seasons to discover insights and gain an understanding of usage patterns using SQL and visualizations in G-Suite. In the next phase of the project, I will use Tableau to create visualizations and answer questions posed by BIXI’s management team. Intuitively, weather can play a role in bike usage, and upon collecting historical weather data for Montreal, I intend to model how daily weather affects bike usage in a third post.
The data from the 2016 and 2017 seasons offers insights into seasonal consumer demand, inbound/outbound traffic patterns, and the types of trips people are taking on BIXI bikes. I highlight growth in the 2017 season and seasonal changes in usage by non-members to make a data-driven recommendation for a promotional campaign. I then analyze traffic for a particularly popular station and look at where customers are using bikes for leisure rides rather than commuting.
The data provided to me for this project has been cleaned and was obtained from the open data portal at Bixi Montreal
My SQL queries for this code can be found on my Github.
2016 - 2017 Overview
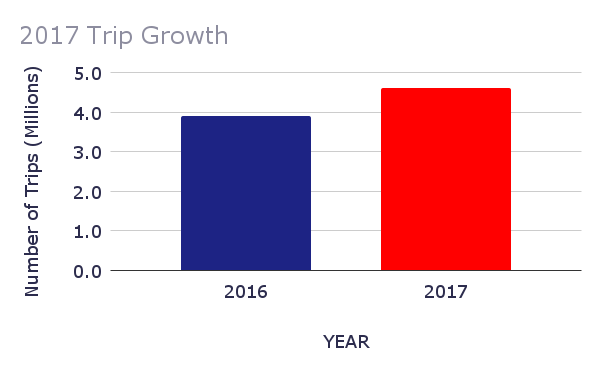
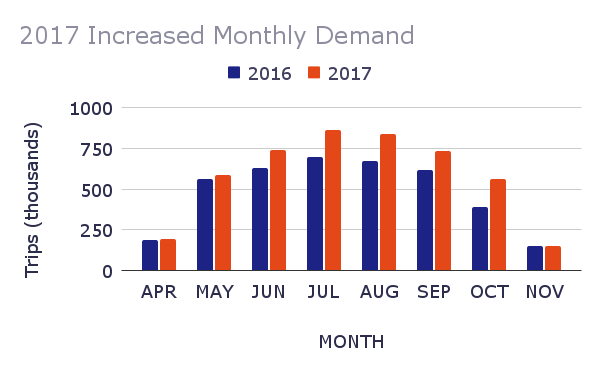
BIXI saw the number of trips rise 19% from just under 3 million trips in 2016 to over 4.5 million trips in 2017. Starting in June, 2017 the average daily number of rides jumped above the 2016 season and remained elevated throughout the rest of the year, excepting the month of November.
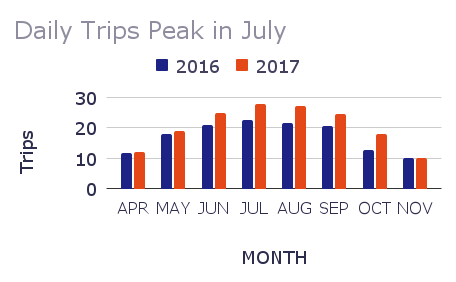
BIXI bikes are only available for half of the month in April and November. These months bookend the winter season in Montreal, when hazardous biking conditions preclude users from biking. April sees slightly more trips taken, suggesting riders are eager to bike in warm weather after experiencing colder temperatures, and less eager to ride in similar conditions after summer when they might feel harsher in comparison to the previous season.
Membership Status
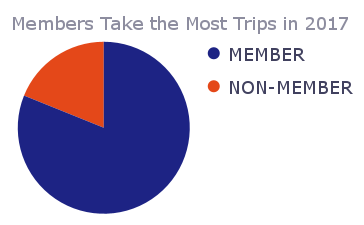
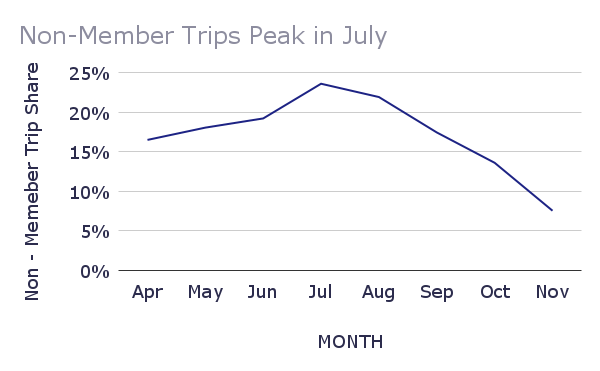
BIXI’s members take the vast majority of trips when compared with non-members. In 2017, members took over 80% of trips. This is not a surprise given the service’s pricing model. Seasonal members get 45 minutes per ride included with their memberships and then are charged $0.10 for usage. Non-members pay a $1 usage fee plus $0.15 per minute of use. The mix of member and non-member rides varied throughout the season in 2017. For April, May, and June, less than 20% of trips are attributed to non-members. July is the month with peak demand. After July, the percentage of member trips drops to the non-member trip low of 8% in November.
Monthly Demand and Promotions
Demand for BIXI bikes was highest for the 2016 and 2017 seasons during the summertime, peaking in July both years. The warm, dry weather during summer months, along with seasonal travel and desire for outdoor fitness and leisure activities, contributes to increased demand. As summer turns to fall and the weather grows cooler, that demand lessens until only the most dedicated and hardy riders take trips in November. The decrease in the dropoff between September and October needs further investigation if additional data can be collected. A quick look at weather data from Montreal shows there were more “unseasonably warm days” in September and October, 2017. Adding weather data to the data set could be modeled and offer more insights to refine comparisons between years.
The relative drop in member trips during the height of summer vacation is to be expected. Both local residents and vacationers are likely to be using BIXI to take advantage of the city’s outdoor attractions. The rise in member rides as the end of the season approaches is also predictable as non-members may become members after trying the service and finding the experience enjoyable. Offering a promotion to entice non-members to sign up for a membership would be most effective in July since data suggests that timing would ensure the campaign reaches the greatest number of targeted non-member users. It also provides new members the opportunity to take advantage of their membership by continuing to use BIXI for more than half of the Montreal biking season.
Station Traffic
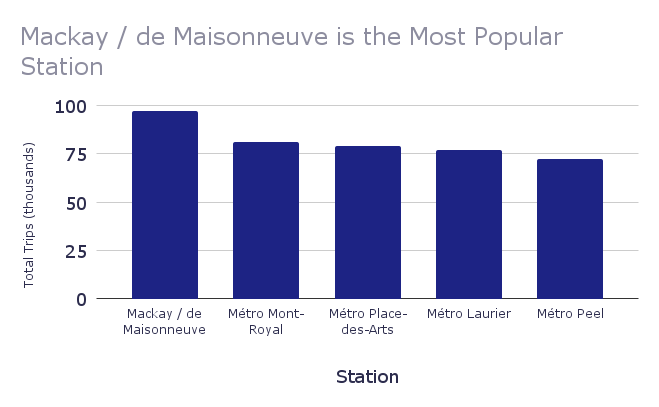
Data from 2016/17 shows Mackay/de Maisonneuve station to be the most popular place for riders to begin a BIXI trip, with nearly 1 million rides during that period. This station is located in the heart of Concordia University, so it is no surprise that it would be a popular location as students finish classes and need to travel to other parts of the campus or home into the city.
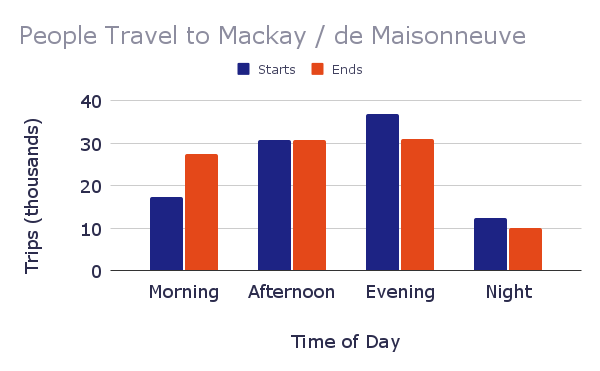
The trip “starts” and “ends” at this station following the expected pattern for a station located in a place where people may spend all or a portion of their day. In the morning, more trips end at the station as students and staff arrive on campus for the day. In the afternoon, there is an even number of beginning and ending trips as some students leave after class and other students arrive for afternoon classes. Full-day and part-day students leave in higher numbers than students that arrive for evening classes. Night traffic is sparse as most of the activity at this location takes place during regular working hours.
Round Trips
There are many times and places traveling by bike would be desirable if it weren’t for the trouble it takes to transport bikes to a recreational location. This is an area where BIXI bikes can really open biking to people who may not be able to transport a bike to a trail or park. The map shows stations where the most bike trips started and ended at the same location. This is somewhat of an unusual case for BIXI. Typically, riders will end a trip at a destination and then start a new trip or travel away using another mode of transport. Even if someone commutes to and from the same locations via BIXI bikes daily, their rides won’t show up as round trips in the trip data. Trips starting and ending at the same location point to people taking longer leisure rides through some of the parks outside Montreal. We would expect these rides to take place away from the city’s center.
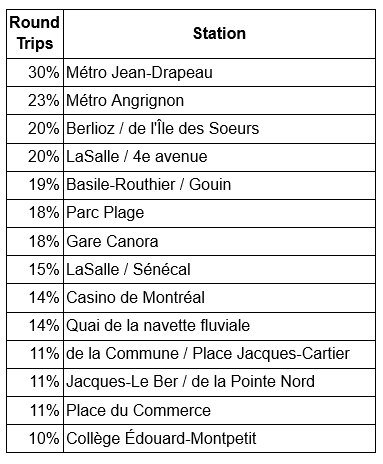
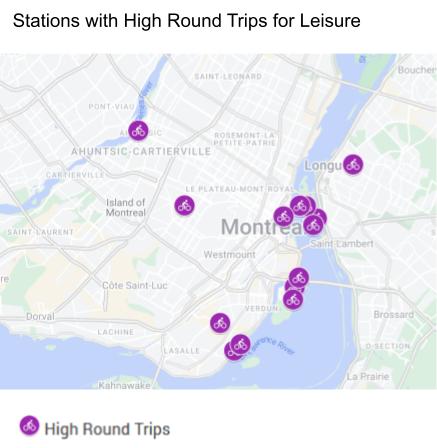
Table 1 lists stations that were the starting points for 500 or more trips, with round trips accounting for over 10% of trips. These stations are also plotted on a map of the Montreal area to communicate their geographic positioning.
Further Analysis
To gain a better understanding of how people use BIXI and what steps the company might take to increase usage, adding bike-centered data would be extremely beneficial. With data about the trips specific bikes have taken, we could answer questions about common traffic routes. It would also be helpful for the company to understand if there are stations where bikes accumulate and lay dormant since the demand for bikes departing from that location is low. It could also help inform parts of BIXI tasked with restocking locations and ensuring there are bikes available in high-demand stations.
User data could also be beneficial in understanding the difference between regular commuter rides and trips taken for a singular purposes or leisure rides. This analysis took a narrow definition of a round trip to mean a single ride that started and ended at a station. From the user point of view, a round trip would likely be two trips taken hours apart, as in the case of commuting. Understanding where and when those needs arise would help bolster confidence that bikes will be available when people need them.
Conclusions
The Montreal bike sharing program managed by BIXI saw excellent growth from the 2016 to the 2017 season. Understanding usage as it relates to seasonal weather should be a key focus in deciding the next steps to take when considering promotions and making decisions about how many bikes need to be in the fleet. Continued growth can only occur as bikes are available to ride as people want them. Over the two seasons available for this analysis, round trip rides were a very small part of the needs served by BIXI. Expanding opportunities for this type of trip may also be an area for BIXI to grow. BIXI has a unique role in serving the transportation needs for the city of Montreal; continuing to collect and explore data generated by the program is vital in ensuring BIXI is doing its best to meet rider needs, now, and in the future.
The data provided to me for this project has been cleaned and was obtained from the open data portal at Bixi Montreal
My SQL queries for this code can be found on my Github.